Know which students
are actually ready.
Give your instructors real-time readiness visibility across every student in a class — no spreadsheet, no manual check-ins.
Inside the staff portal
What your instructors actually see
Six screens from a live demo intake. No mock-ups — this is the portal your staff sign in to.
#INTAKES
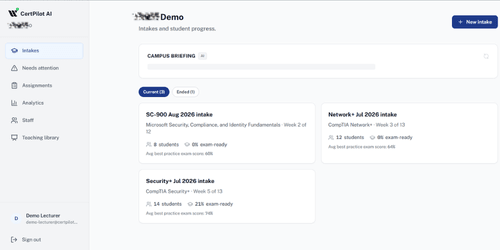
Every intake on one screen
Current and ended intakes side by side, each with its roster size, how many are exam-ready, and the average best score across practice exams sat in exam mode.
Landing screen
#DASHBOARD
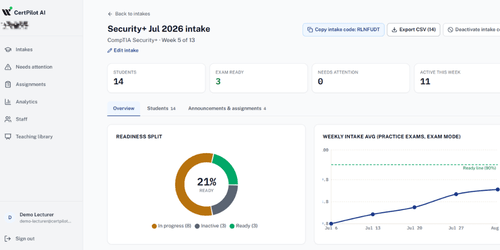
Readiness at a glance
Students, exam-ready count, how many need attention, and who was active this week — over a readiness split and the intake’s weekly average across practice exams taken in exam mode.
Per intake
#STUDENTS
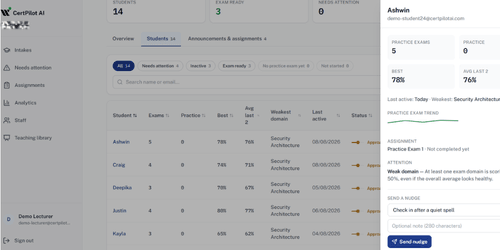
Open any one student
Exams sat, best and average scores, weakest domain and last activity — with a nudge you can send from the same panel, in words the product supplies.
From the roster
#DIRECTED WORK
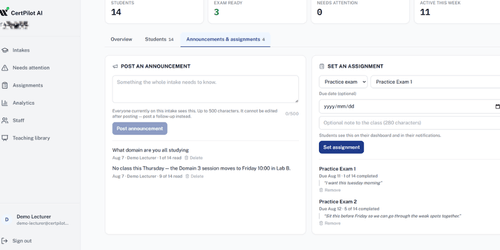
Set the work, and say something
Post an announcement to the intake, or set a practice exam with a due date. Completion is read from the student’s own attempt afterwards, so the figure can’t move before they do the work.
Announcements & assignments
#ANALYTICS
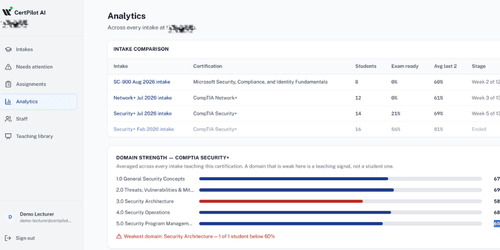
Compare intakes, not just students
Every intake lined up with its stage and exam-ready count, plus domain strength averaged across the intakes teaching a certification — a domain that is weak everywhere is a teaching signal, not one student.
Across the school
#TEACHING
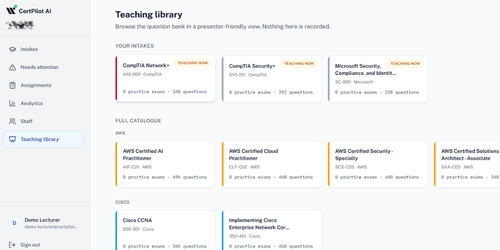
Teach from the same question bank
A presenter-friendly view of the questions your students get, across your intakes and the full catalogue. Nothing you open here is recorded against anyone.
Read-only by design
Why schools use it
Three things you can't get from a spreadsheet
Readiness at a glance
A donut chart, a weekly trend line, and a domain heatmap per intake — know who’s exam-ready before exam day, not after.
One code, instant access
Share an intake code. Students join in seconds and get full access for the duration of the intake — no seat management.
Catch the quiet ones early
Students who’ve gone quiet (14+ days inactive) are flagged automatically, right alongside their readiness state.
Simple, per-intake pricing
R6,000
per intake of up to 20 students
Covers the full intake plus the exam-booking window — up to 4 months
Request a pilot
Tell us about your school and we'll set up your first intake, on us.